Short Summary
At U.C. Davis, my main interest was working to understand how plants responded to and adapted to their environments. I was particularly interested in crop varieties grown in extreme environments, and how crosses between crop varieties altered their crop yield.
To study this, I was using a moledule called ribonucleic acid, RNA, which is a metric of gene expression. In this study, I was measuring the gene expression of high performed corn varieties that had been crossed to corn’s wild relative, teosinte.
My Questions
Are there genes whose gene expression change are significantly different from the gene expression of either of the parents?
As a starting point, before generating my own data, I used gene expression data from Hufford et al.
Tools and Methods
Tools and skills Used:
- linux and bash scripts
- custom bioinformatics pipeline (outlined below)
- R
- linear regression and linear mixed regression
- kallisto
- limma
Here is my general work flow:
1 Project Set-Up
For my sanity and for the benefit of my future self, I always observe a general project directory design:
Project/
    ├── analysis/
    ├── data/
    │   ├── processed/
    │   └── raw/
    ├── logs/
    ├── README.md
    ├── useful_info/
    └── scripts/
Specific projects may deviate in little ways, but this is the general directory set up that I’ve found useful.
2 Obtaining the data
This is done all on the command line and in a linux environment. I write bash scripts and make copious use of submitting array jobs to UC Davis’s high performance computing resource.
- find the project identification numbers for the files I want to download
- use samtools to download data files from SRA
- check to make sure file downloaded correctly
- Download reference corn genome from maizeGDB and verify it downloaded correctly
- index the corn reference genome using kallisto
I used data from 151 samples from corn, teosinte, and corn-teosinte hybrids collected from leaf tissue.
3 Generating gene expression counts
Next, I quantified transcript abundance for the gene expression data.
For this step, I opted to use kallisto, though a more rigorous comparison between kallisto and salmon would be necessary to determine the correct tool for this experiment.
This step was done using bash scripts. I bootstrapped the kallisto analysis 100 and took the mean of the bootstrapped values. The output of this step is data with the estimated abundance for each gene in the corn genome, across 151 samples.
4 Linear Modeling of Gene Expression
Now the fun part - building models to determine what genes are different. I compared the gene expressions from the corn-teosinte crosses to each of the parents, and identified genes that were significantly differentially expressed from the gene expression of either parent.
I performed this analysis in R and used limma to build the linear models and produce the log fold change results.
Analysis
I was excited to find that there were many genes that were expressed outside the expected expression patterns of their parents. About 40% of genes in the corn genome were disregulated in at least one out of 30 crosses.
There is a lot to parse out here, and this is a fairly complex story that is not nearly complete. Here are my high-level summaries of some observations of my data.
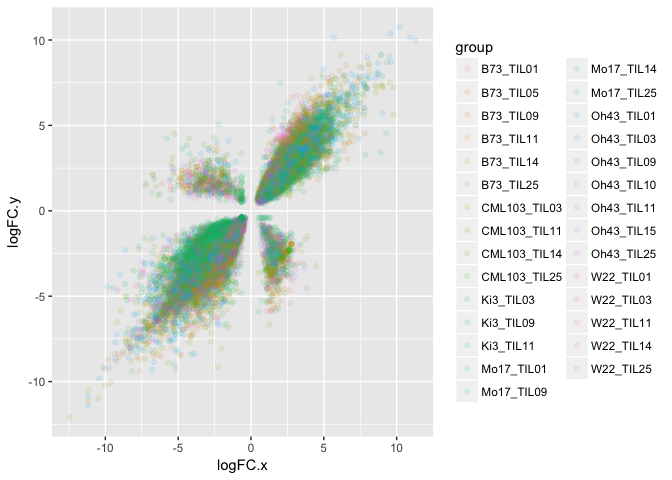
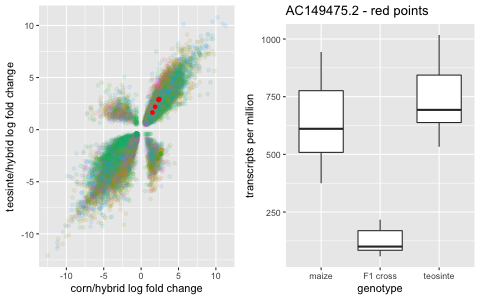
The y-axis is the log fold change between the hybrid offspring and the teosinte parent, and the x-axis is the log fold change between the hybrid offspring and the corn parent. In other words, a positive value indicates that the gene is expressed higher in the offspring than a parent and a negative value is expressed less in the offspring than a parent. The different colors are the different crosses (The first identifier is the corn parent, and the TILXX is the teosinte parent identifier.)
Below are visuals of what that means:
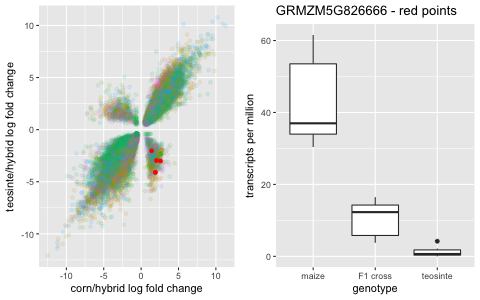
A gene that is additive is expressed in between the parents. This analysis captures genes that are different from either parent, but still expressed at mid-parent level.
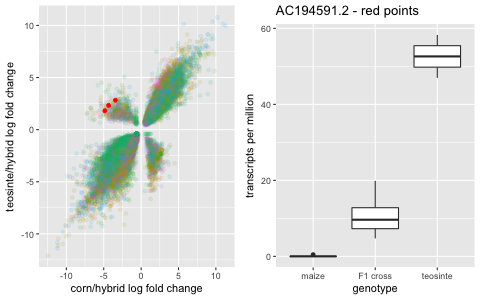
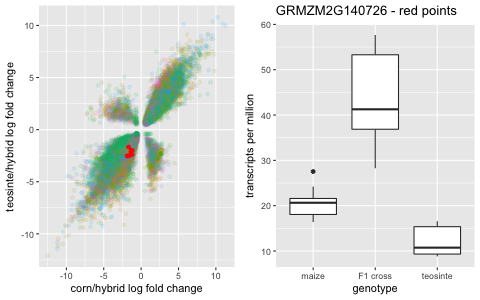
And then it gets interesting. In the other two quadrants, there are genes that are significantly under-expressed or significantly over-expressed in the hybrid compared to the parent gene expression.
Conclusion and Remarks
There are currently lots of interesting things to investigate here. A few things not yet examined:
- disregulated genes shared across multiple crosses
- gene functions of disregulated genes
- disregulated gene clusters - how do these genes cluster
- are some crosses worse than others?
- What are the phenotypes of the hybrid crosses (this data was unavailable)
This project is definitely in its infancy, and there are multiple different layers to this analysis. But, we were excited that there did seem to be some potential in the role that disregulated genes could play in the overall success of a hybrid.